How Many kWh Does a Solar Panel Produce?

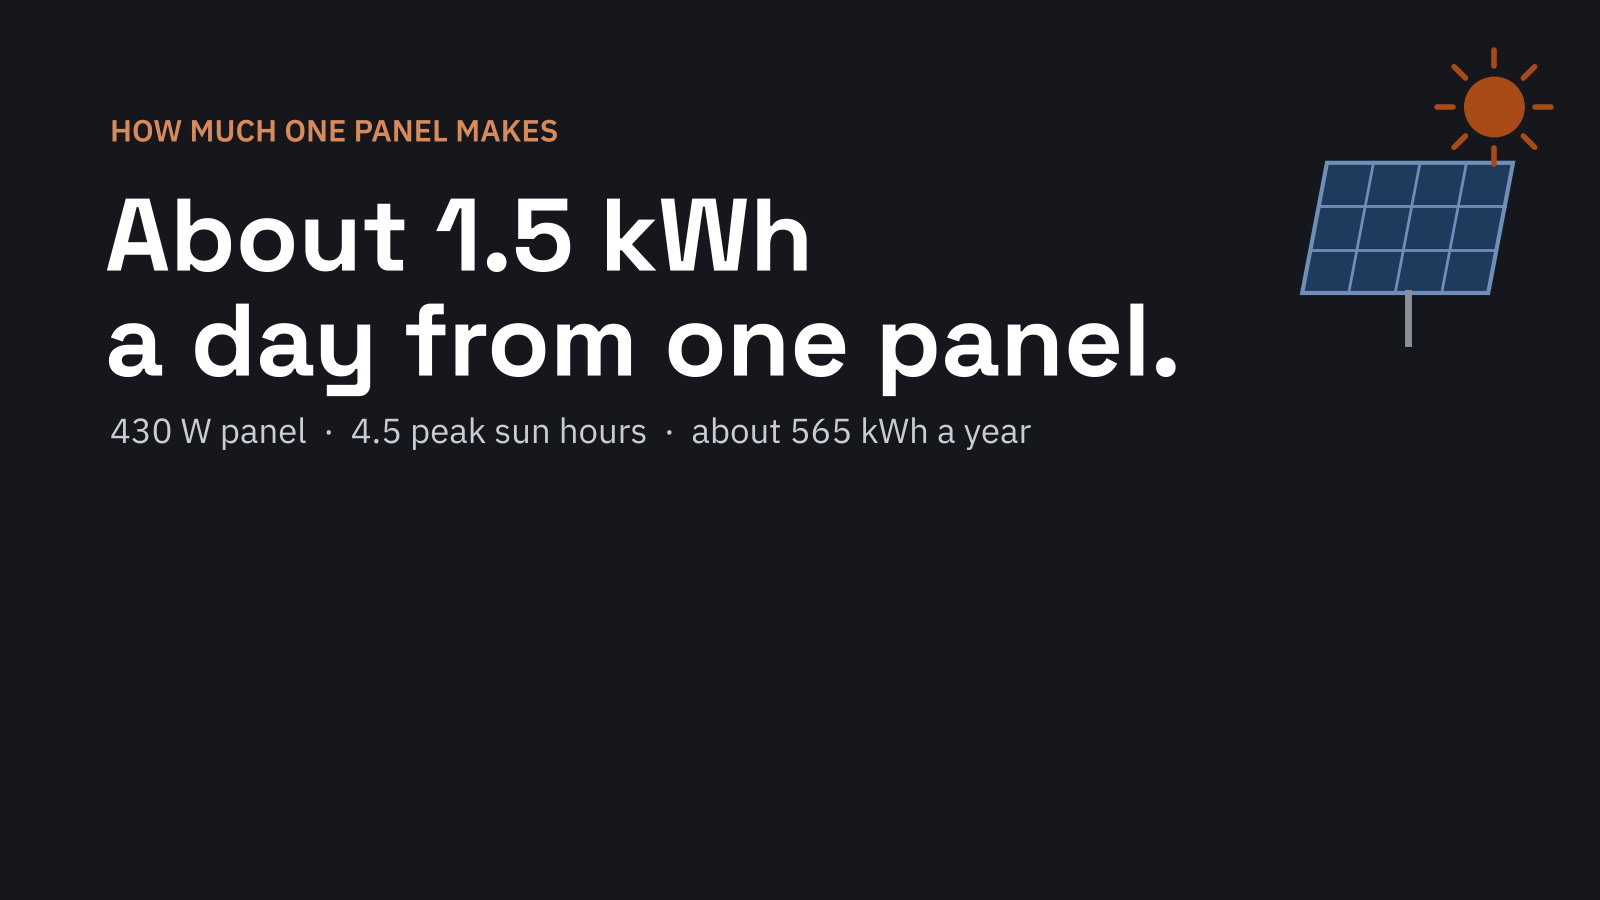
How many kWh does a solar panel produce? A typical 430-watt home solar panel makes about 1.5 kWh of electricity a day, or roughly 550 to 600 kWh a year in an average US location. The same panel makes about 755 kWh a year in Arizona and about 470 kWh in Seattle, so the real number for your roof depends on three things: the panel’s wattage, how many peak sun hours your area gets, and how much is lost to heat, wiring, dust and shade. This guide gives you the formula, a calculator, and output figures by panel size and by state.
The formula: watts × sun hours × losses
A panel’s wattage is its power under standard test conditions: full, strong sunlight of 1,000 watts per square meter on a cell at 25 °C. That is a rate, not an amount of energy. To get energy in kWh you multiply power by time, which is the same idea as kW vs kWh. The time that counts is peak sun hours.
A peak sun hour is one hour of sunlight at that full 1,000 W per square meter. A summer day may have 14 hours of daylight, but the weak morning and evening light adds up to only five or six peak sun hours. Most of the US gets between 4.5 and 5.5 peak sun hours a day averaged over the year.
The 0.8 factor covers real-world losses: panels running hotter than 25 °C, the inverter converting DC to AC, wiring, dust, partial shade and small mismatches between panels. The federal PVWatts model assumes 14% system losses before it even accounts for heat, so a total of about 20% is a fair planning figure. It is the same factor our solar panel calculator uses.
Daily kWh = panel watts × peak sun hours × 0.8 ÷ 1,000
Worked example: a 430 W panel, 4.5 peak sun hours. 430 × 4.5 × 0.8 = 1,548 Wh, or 1.55 kWh a day. Multiply by 365 for about 565 kWh a year, and divide that by 12 for about 47 kWh a month.
Solar panel output calculator
Enter your panel wattage, the number of panels and your peak sun hours. If you do not know your sun hours, use the state table further down, or 4.5 as a middle-of-the-road US figure. The calculator applies the same 20% loss factor as the formula above.
Estimate uses watts × peak sun hours × 0.8 (about 20% real-world losses). Value assumes every kWh offsets grid power at the price you enter.
How many kWh a solar panel produces by wattage
The table uses 4.5 peak sun hours and the 0.8 loss factor. Small 100 W and 200 W panels are common on RVs, sheds and portable power stations; 400 W and up is the norm on house roofs.
| Panel | Per day | Per month | Per year |
|---|---|---|---|
| 100 W | 0.36 kWh | 11 kWh | 131 kWh |
| 200 W | 0.72 kWh | 22 kWh | 263 kWh |
| 300 W | 1.08 kWh | 33 kWh | 394 kWh |
| 400 W | 1.44 kWh | 44 kWh | 526 kWh |
| 430 W | 1.55 kWh | 47 kWh | 565 kWh |
| 450 W | 1.62 kWh | 49 kWh | 591 kWh |
| 500 W | 1.80 kWh | 55 kWh | 657 kWh |
About 97% of home panels quoted on EnergySage in the first half of 2026 were rated 400 to 460 W, and 430 to 440 W was the most common size. A higher wattage does not always mean a better panel. Two panels with the same efficiency differ in wattage only because one is physically larger. If your roof is small, compare efficiency (most home panels convert 17 to 23% of sunlight) rather than wattage alone.
How much a solar panel produces by state
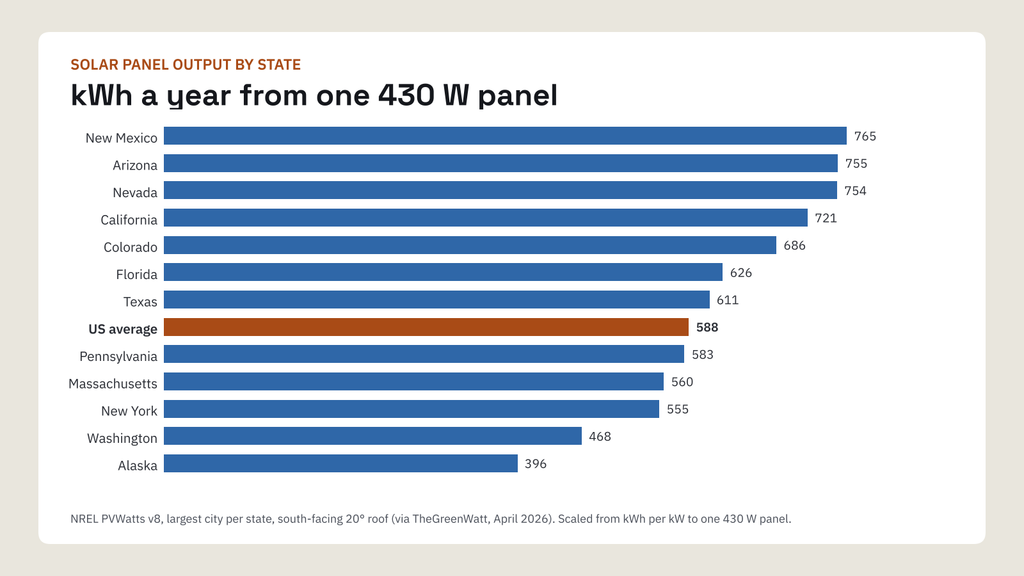
The figures below come from NREL’s PVWatts model, run for the largest city in each state with a south-facing roof at a 20° tilt. They include heat and system losses, so they are a little more conservative than the simple 0.8 rule. We converted the model’s output per kilowatt into output for one 430 W panel.
| State (city modeled) | Peak sun hours | kWh per year, one 430 W panel | kWh per month | 430 W panels for 865 kWh a month |
|---|---|---|---|---|
| Arizona (Phoenix) | 6.54 | 755 | 63 | 14 |
| New Mexico (Albuquerque) | 6.42 | 765 | 64 | 14 |
| Nevada (Las Vegas) | 6.41 | 754 | 63 | 14 |
| California (Sacramento) | 6.08 | 721 | 60 | 15 |
| Colorado (Denver) | 5.66 | 686 | 57 | 16 |
| Florida | 5.48 | 626 | 52 | 17 |
| Texas (Houston) | 5.22 | 611 | 51 | 17 |
| Georgia | 5.17 | 611 | 51 | 17 |
| US average | 4.98 | 588 | 49 | 18 |
| Pennsylvania | 4.79 | 583 | 49 | 18 |
| Massachusetts | 4.70 | 560 | 47 | 19 |
| New Jersey | 4.66 | 561 | 47 | 19 |
| Illinois | 4.51 | 562 | 47 | 19 |
| New York | 4.50 | 555 | 46 | 19 |
| Washington (Seattle) | 3.95 | 468 | 39 | 23 |
| Alaska (Anchorage) | 3.17 | 396 | 33 | 27 |
State averages hide big differences inside some states. Eastern Washington gets more than 5 peak sun hours a day while Seattle gets about 4, and inland California beats the foggy coast by about a quarter. For your own address, run the free PVWatts calculator with your roof’s direction and tilt.
Summer vs winter output
Annual averages flatten out a large seasonal swing. Longer days and a higher sun angle in summer can double or triple a panel’s daily output compared with December, and the gap grows the farther north you live.
| City | Best month (sun hours) | December (sun hours) | 430 W panel, best month | 430 W panel, December |
|---|---|---|---|---|
| Phoenix | June (8.2) | 4.8 | 2.8 kWh/day | 1.6 kWh/day |
| Boston | July (6.1) | 2.3 | 2.1 kWh/day | 0.8 kWh/day |
| Seattle | June (5.7) | 1.4 | 2.0 kWh/day | 0.5 kWh/day |
For a grid-tied home with net metering, the annual total is what matters, because summer surplus offsets winter shortfall on your bill. If you size panels to charge a solar battery for backup, or you live off-grid, plan around the worst month instead.
What lowers real-world output
- Roof direction. South-facing roofs produce the most in the US. East- or west-facing panels make roughly 10% less over a year, and north-facing panels about 30% less.
- Shade. A chimney, tree or neighboring house that shades part of the array for a few hours can cut output far more than its size suggests, especially with a single string inverter. Microinverters and optimizers limit the damage to the shaded panels.
- Heat. Panels lose power as they warm above 25 °C. The loss is set by the panel’s temperature coefficient, typically −0.24% to −0.5% per °C. On a hot day a roof panel can reach 65 °C; at −0.35% per °C, being 40 °C above the test temperature costs about 14% of output. Look for a coefficient close to zero if you live somewhere hot.
- Dirt and snow. Dust and pollen typically cost 1 to 5% in most of the US and more in dry, dusty areas. Our solar panel maintenance guide covers when cleaning pays off.
- Age. Panels lose about 0.5% of their output a year, so a 430 W panel makes roughly 88% of its first-year energy by year 25. See how long solar panels last.
What one solar panel can power
About 1.5 kWh a day is roughly what a full-size refrigerator uses. It would also add about 5 miles of driving to an electric car that goes 3.5 miles per kWh, or cover a laptop, router and LED lights with plenty to spare. At the average US electricity price of about 18.3 cents per kWh, one 430 W panel’s 565 kWh a year is worth about $100.
One panel is also the scale of a balcony system. Our guide to plug-in solar panels explains where a single panel can legally be plugged into a wall outlet and what it saves.
From one panel to a whole-house system
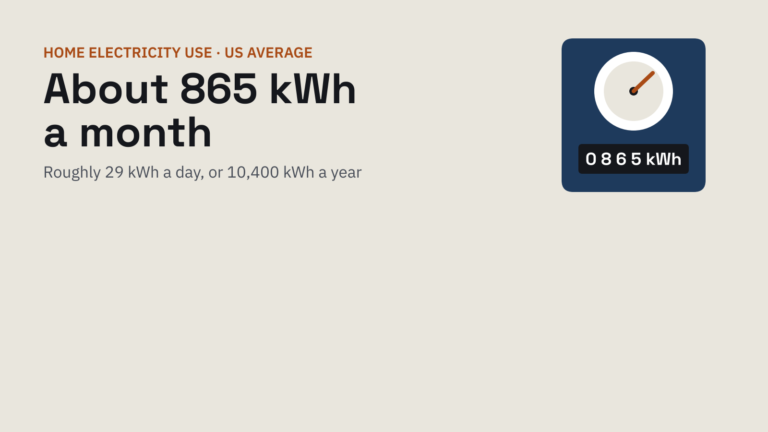
An average US home uses about 865 kWh a month, or 10,380 kWh a year (see how many kWh a house uses). At 565 kWh per panel, that takes about 18 to 19 panels of 430 W, an 8 kW system. EnergySage puts the typical range at 16 to 23 panels, and the average system quoted on its marketplace is about 12 kW, because many buyers also plan for an EV or a heat pump.
To size a system from your own bill, use our how many solar panels do I need calculator. Our guides to solar panel cost and the solar panel payback period turn the kWh into dollars.
How to check an installer’s production estimate
Every solar quote should include an estimated annual production in kWh. Divide it by the system size in watts to get the production ratio. For example, 11,000 kWh from an 8,000 W system is a ratio of about 1.4. Most of the lower 48 states fall between about 1.1 and 1.8: around 1.75 in Arizona, 1.37 for the US average and 1.1 in Seattle.
- Run your address in PVWatts with the same system size, tilt and direction as the quote.
- If the installer’s estimate is more than about 10% above PVWatts, ask how they modeled shade and losses.
- Check whether the estimate is for year one only. Production falls about 0.5% a year after that.
FAQ
How many kWh does a 400 watt solar panel produce per day?
About 1.4 kWh a day at 4.5 peak sun hours. Averaged over the year, the range across the US is roughly 1.0 kWh a day in Alaska to about 2 kWh a day in Arizona.
How many kWh does a 10 kW solar system produce?
About 13,000 to 14,000 kWh a year in an average US location: 10 × 4.5 × 0.8 × 365 gives 13,140 kWh, and PVWatts gives about 13,670 kWh for the US average. In Arizona it is closer to 17,500 kWh; in Seattle about 10,900 kWh.
Do solar panels produce electricity on cloudy days?
Yes, but much less. Panels work on diffuse light that passes through clouds, so they keep producing under overcast skies, just at a fraction of their clear-day output. Peak sun hour figures already include typical cloudy days for each location.
Why does my panel never reach its rated wattage?
The rating assumes perfect lab conditions: strong sunlight hitting the panel straight on with the cells at 25 °C. On a real roof the sun is at an angle for most of the day and the cells run hotter, so peak readings of 70 to 85% of the rating are normal.
Sources
- EnergySage: How much energy does a solar panel produce? (updated October 20, 2026)
- TheGreenWatt: Average peak sun hours by state, NREL PVWatts v8 data (April 2026)
- PVWatts Calculator (National Laboratory of the Rockies, formerly NREL)
- US Department of Energy: Energy Department renames NREL “National Lab of the Rockies” (December 1, 2025)
- EnergySage: How hot do solar panels get? Temperature coefficients explained
- EIA: How much electricity does an American home use?